

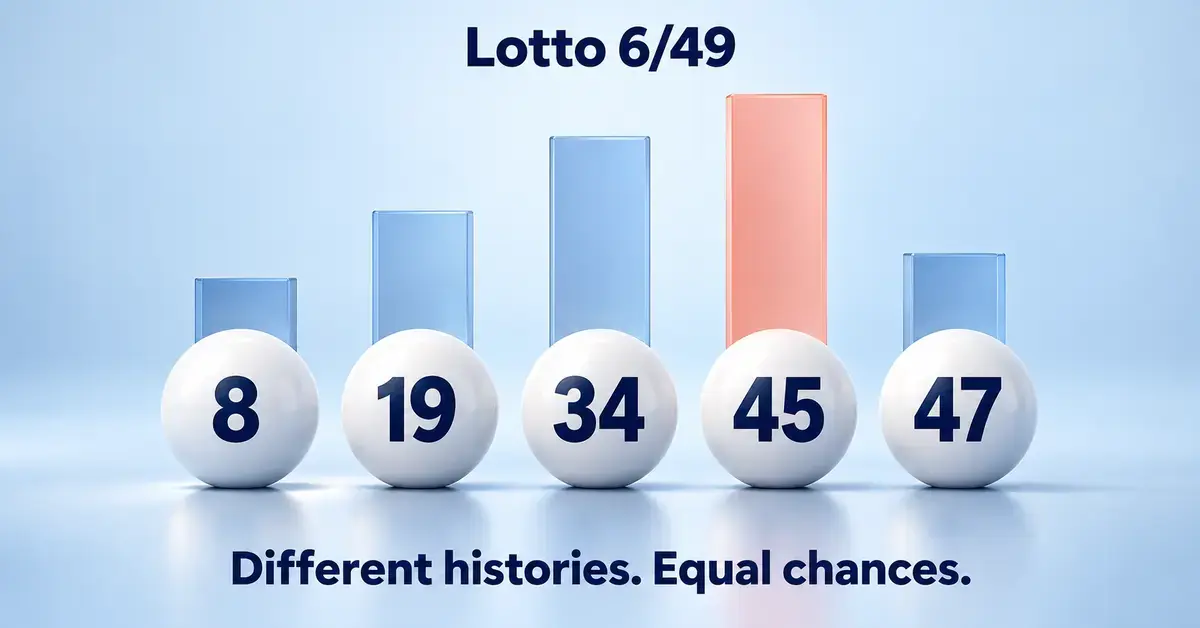
If you search for the most common Lotto 6/49 numbers, you will find plenty of lists — and the one that turns up most often is 45, the single main number drawn more times than any other since the game began in 1982. That is a real, countable fact. What it is not is a tip. Lotto 6/49 is a random draw, and no number that came up frequently in the past is any more likely to come up in the next draw. This guide gives you the actual frequency data readers come looking for, shows why the popular statistics sites rarely agree with each other, and explains in plain English what those numbers can and cannot do for you.
Key Takeaways
- Most-drawn number on record: 45, at roughly 600 appearances since 1982, with 34 close behind.
- It doesn’t predict anything: every number has the same 1-in-49 chance per position in each independent draw.
- Jackpot odds are fixed: matching all six is 1 in 13,983,816 no matter which numbers you pick.
- Trackers disagree because they count different draw sets and update at different times — the lists are snapshots, not official records.
- The only real effect of chasing popular numbers is a higher chance of sharing a prize, not winning one.
What does “most common Lotto 6/49 numbers” actually mean?
“Most common” simply means the main numbers that have been drawn the greatest number of times across the game’s history. In the CLASSIC draw you pick six numbers from 1 to 49, and that range has stayed the same since the first Lotto 6/49 draw on 12 June 1982. Because the pool of 49 numbers has never changed, every draw ever held counts toward the same frequency tally — which is why 6/49 is one of the few lotteries where an all-time “most drawn” list is even meaningful.
Over more than four decades of twice-weekly draws, that adds up to roughly 4,400 to 4,500 CLASSIC draws. Each draw produces six main numbers (plus a separate bonus number), so somewhere around 26,000 to 27,000 main-number “appearances” have been recorded. Spread evenly across 49 numbers, that works out to an expected average of about 545 appearances per number. The numbers people call “hot” or “most common” are the ones sitting a little above that average — and, as you will see, “a little” is the key phrase.
Which Lotto 6/49 numbers have been drawn most often?
The number drawn most often in Lotto 6/49 history is 45. Independent tracking sites put it at roughly 600 appearances — a few dozen above the ~545 you would expect from pure chance. After 45, the number 34 is consistently near the top as well. Below those two, the rankings start to drift apart depending on which site you look at and when it was last updated.
The snapshot below shows how two well-known statistics trackers ranked the most-drawn main numbers. Notice that they agree on the leaders and disagree almost immediately afterward — that disagreement is itself one of the most useful things this data can teach you.
Number Frequency Snapshot
| Statistics tracker | Draws analysed (approx.) | Most-drawn main numbers (high to low) |
|---|---|---|
| Smartlottos | ~4,459 | 45, 34, 31 |
| Lotolens | ~3,974 | 45, 34, 40, 23, 46, 31 |
| Expected average per number over ~4,450 draws: about 545 appearances. 45 leads at roughly 600 — only modestly above average. Third-party snapshots as of late 2025/2026; figures change with every draw and are not official. | ||
A few honest caveats about any list like this:
- These are third-party counts, not official ones. Canada’s lottery corporations publish winning numbers, not ranked “most common” tables. Independent sites compile the history themselves, so small differences in their data sets produce different rankings.
- They are snapshots. Every Wednesday and Saturday draw adds six more results, so a list that is accurate today can reshuffle within weeks. A number that is “second most common” this month can slip to fifth by next year.
- The gaps are tiny. The difference between the most-drawn and least-drawn number is usually only a few percent of the total. That spread is exactly what mathematicians expect from randomness, not evidence of a pattern.
Why do some numbers appear more often than others?
Some numbers lead the frequency table purely because of random variation, not because of any bias in the machine. If you flip a fair coin 100 times you will almost never get exactly 50 heads and 50 tails — you might get 55 and 45. Nobody would call heads “hot.” Lotto 6/49 works the same way on a larger scale: with thousands of draws, some numbers inevitably land above the average and some below it, and the ones on top become the “most common” list.
There is also a long-run force working against big gaps, called the law of large numbers. As the number of draws grows, each number’s share of appearances drifts closer to its true probability of 1 in 49 per position. The modern Lotto 6/49 uses a certified random number generator for its draws, and over a large enough sample every number trends toward the same frequency. That means the lead held by a number like 45 tends to shrink in relative terms as more draws pile up, not grow. You can read more about how those probabilities are built in our explainer on how lottery odds are calculated.
Do the most common numbers have a better chance of being drawn next?
No. The most common numbers have exactly the same chance of being drawn in the next draw as every other number — no better, no worse. This is the single most important point in the whole topic. Each Lotto 6/49 draw is independent: the balls (or the random number generator) have no memory of what happened last time, so previous results cannot influence the next outcome.
Believing otherwise is a well-documented thinking error known as the gambler’s fallacy — the mistaken feeling that past results change future odds. In a random draw, the probability that 45 (or any specific number) appears is the same this Saturday as it was for its very first draw. Picking the historically “hottest” six numbers does not raise your odds of matching all six above the fixed figure of 1 in 13,983,816. That jackpot probability is set by the math of choosing 6 numbers from 49, and no selection method changes it. The same logic is why Quick Pick and choosing your own numbers give you identical odds.
What about “overdue” or cold numbers?
“Overdue” numbers are just as much a myth as “hot” ones. Some players flip the strategy around: instead of chasing frequent numbers, they bet on the ones that have not appeared in a long time, assuming they are “due.” But a number is never due. Because each draw is independent, a number that has been absent for 40 draws has precisely the same 1-in-49 chance per position as one that appeared last week.
Cold-number lists and hot-number lists are two sides of the same error. Both treat random history as if it predicts the future, and neither can. The only thing a frequency chart reliably tells you is what already happened — it has zero forecasting power for the next set of balls.
Why do the statistics sites disagree with each other?
The main reason different sites show different “most common” numbers is that they count different sets of draws. One site might analyse every draw since 1982; another might start from the 2022 redesign; a third might quietly include or exclude the bonus number, or lag a few draws behind on updates. Each of those choices nudges the totals, and because the real gaps between numbers are so small, even a minor difference in the data set is enough to swap positions three through ten.
This is why you should treat any single “most drawn numbers” list with caution. It is not that one site is lying and another is telling the truth — they are all reporting slightly different slices of the same random history. The disagreement is a feature of randomness, not a sign that somebody found the “correct” hot numbers.
Does picking common numbers change what you could win?
Choosing popular numbers will not change your odds of winning, but it can change how much you take home if you do. Lotto 6/49’s CLASSIC jackpot and several lower tiers are pari-mutuel in nature for the shared pools, meaning a prize is split among everyone who matched that tier. If your six numbers happen to be a combination many other people also play, a jackpot win could be divided among several tickets, shrinking each share.
This matters because “common” playing patterns are predictable even though the draw is not. Huge numbers of players pick:
- Birthdays and anniversaries, which crowds the numbers 1 to 31.
- Numbers that form neat lines or patterns on the ticket grid.
- The very “hot” numbers these frequency articles promote, such as 45 and 34.
So the one real, practical effect of chasing the “most common” numbers is counter-intuitive: by playing what everyone else plays, you raise the chance of sharing a prize rather than winning it alone. It has no effect whatsoever on whether you win in the first place. For the full tier-by-tier picture of what each match pays, see our Lotto 6/49 odds and prize breakdown.
Common mistakes people make with Lotto 6/49 number statistics
The biggest mistake is assuming the data predicts anything at all. Here are the traps that trip people up most often:
- Treating “most common” as “most likely next.” Past frequency and future probability are unrelated in a random draw.
- Reading short-term “hot number” widgets as history. Many sites show numbers that are hot over the last 10 or 50 draws — a tiny sample that is basically noise, not an all-time record.
- Paying for “prediction” systems or software. No formula can forecast a certified random draw. Any product that promises to does not work, and spending money on it only increases your losses.
- Mixing up the main numbers and the bonus/Gold Ball draws. The all-time list refers to the six CLASSIC main numbers. The bonus number and the separate Gold Ball jackpot draw have their own mechanics and should not be lumped into the same frequency chart.
- Forgetting the data is a moving target. A ranking you memorised a year ago is already out of date.
So how should you choose your Lotto 6/49 numbers?
Since every combination has the identical 1-in-13,983,816 chance, there is no “best” way to choose that improves your odds — pick whatever method you enjoy. A Quick Pick, your own favourite numbers, the historically most-common numbers, or a completely random scribble all carry the same probability of hitting the jackpot. The only choice with a measurable (if small) effect is avoiding the heavily shared patterns above, which can help you keep more of a prize to yourself rather than split it.
If you want the ground rules first — ticket price, draw days, the CLASSIC and Gold Ball components and what a $3 play includes — start with our overview of how Lotto 6/49 works. Beyond that, treat the game as what it is: a form of entertainment with a fixed, long jackpot probability, not an investment or a puzzle to be solved with the right numbers.
A note on responsible play
This article is for information only and is not advice to play the lottery or a strategy for winning. No set of numbers — common, overdue, lucky or random — improves your odds of winning Lotto 6/49, and the expected value of any ticket is negative, meaning players lose money on average over time. Play only for entertainment, only with money you can afford to lose, and only if you are of legal age in your province.
If gambling is causing stress for you or someone you know, free, confidential help is available across Canada. In Ontario you can reach ConnexOntario 24/7 at 1-866-531-2600, and every province has its own support programs such as OLG PlaySmart and BCLC GameSense. See our responsible gambling guide for the full list of help lines and warning signs. LottoGuide.ca is an independent, unofficial resource and is not affiliated with any lottery corporation.
Sources
- Ontario Lottery and Gaming (OLG) — official Lotto 6/49 information
- CTV News Saskatoon — “The new Lotto 6/49: Gold Ball Draws and more”
- Daily Hive — “Lotto 6/49 is changing this weekend”
- Smartlottos — Lotto 6/49 number frequency
- Lotolens — Canada Lotto 6/49 number statistics
- LottoNumbers — Lotto 6/49 statistics
Frequently Asked Questions (FAQ)
What is the most drawn number in Lotto 6/49?
Across Lotto 6/49’s history since 1982, the main number drawn most often is 45, which independent trackers put at roughly 600 appearances. The number 34 is consistently close behind. These are historical counts only and do not make either number more likely to be drawn next.
Do the most common numbers have better odds of winning?
No. Every number has the same 1-in-49 chance per position in each draw, and any full combination of six numbers has the same 1-in-13,983,816 chance of winning the jackpot. Past frequency has no effect on future draws because each draw is independent.
Why do different websites list different “most common” numbers?
Because they count different sets of draws and update at different times. One site may include every draw since 1982 while another starts later or handles the bonus number differently. Since the real gaps between numbers are tiny, those choices easily change the rankings.
Are “overdue” numbers more likely to come up?
No. A number that has not appeared for a long time is not “due.” The draw has no memory, so an absent number has exactly the same probability as any other. Betting on overdue numbers is the same gambler’s-fallacy error as chasing hot numbers.
Does picking rare numbers help me win more money?
Picking less popular numbers does not change your chance of winning, but it can reduce the risk of splitting a prize. Because many players choose birthdays (1–31) and well-known “hot” numbers, avoiding those crowded picks means a jackpot win is more likely to be yours alone rather than shared.
